Debugger interface overview v17
The main debugger window contains two panels:
- The top Program Body panel displays the program source code.
- The bottom Tabs panel provides a set of tabs for different information.
Use the tool bar icons located at the top panel to access debugging functions.
The Program Body panel
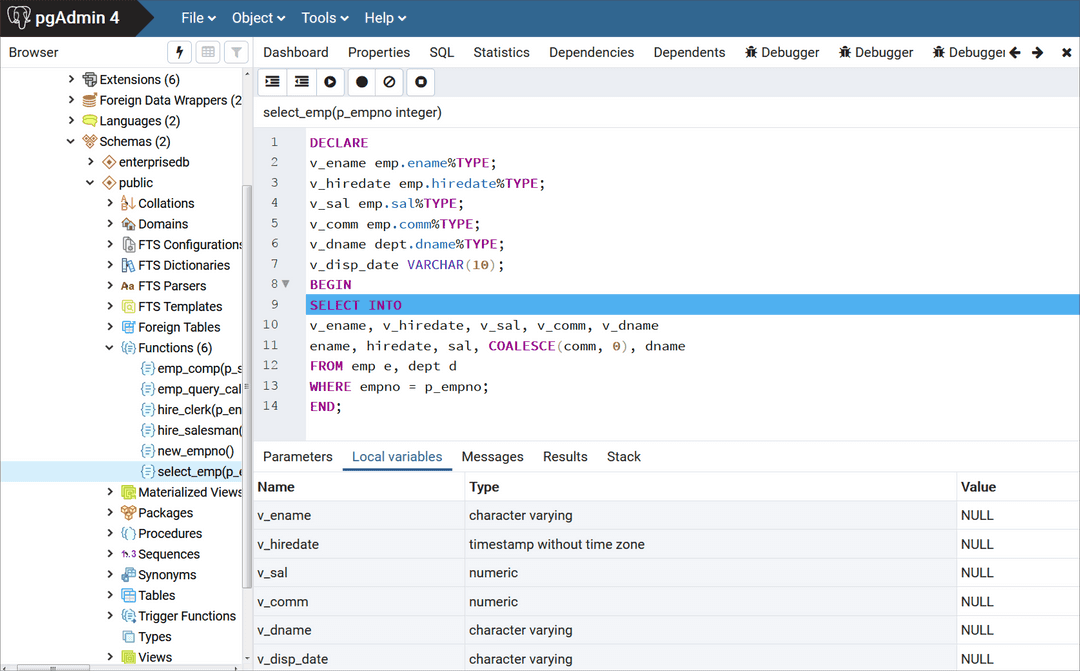
The Program Body panel displays the source code of the program that's being debugged. The figure shows that the debugger is about to execute the SELECT statement. The blue indicator in the program body highlights the next statement to execute.

The Tabs panel
You can use the bottom Tabs panel to view or modify parameter values or local variables or to view messages generated by RAISE INFO and function results.
The following is the information displayed by the tabs in the panel:
- The Parameters tab displays the current parameter values.
- The Local variables tab displays the value of any variables declared in the program.
- The Messages tab displays any results returned by the program as it executes.
- The Results tab displays any program results, such as the value from the
RETURNstatement of a function. - The Stack tab displays the call stack.
The Stack tab
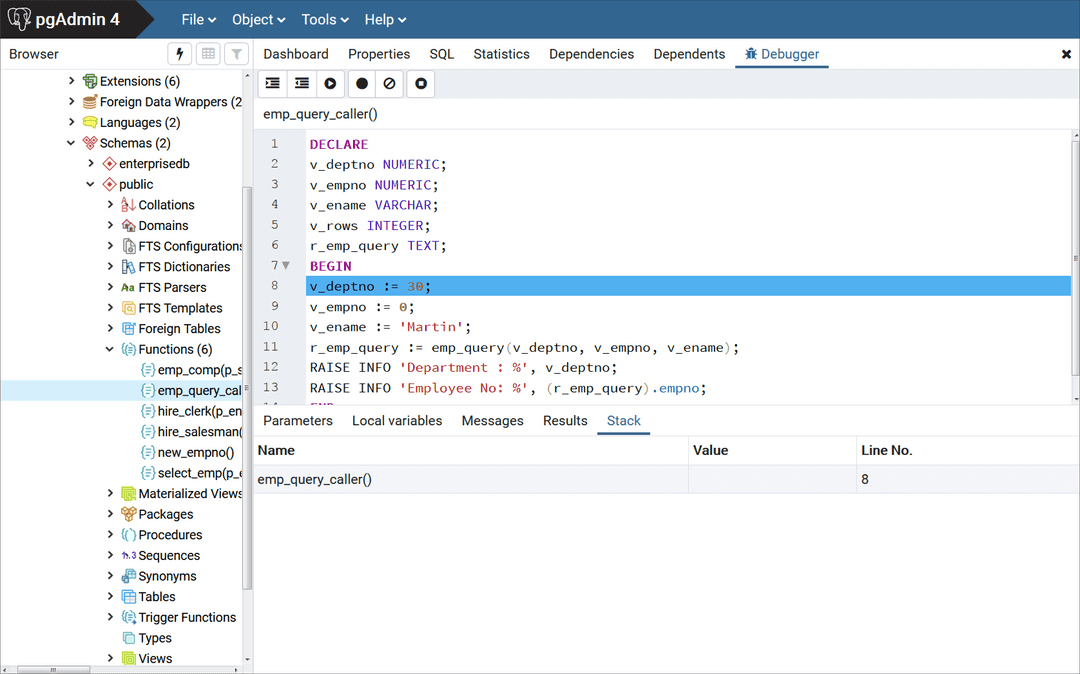
The Stack tab displays a list of programs that are currently on the call stack, that is, programs that were invoked but that haven't yet completed. When a program is called, the name of the program is added to the top of the list displayed in the Stack tab. When the program ends, its name is removed from the list.
The Stack tab also displays information about program calls. The information includes:
- The location of the call in the program
- The call arguments
- The name of the program being called
Reviewing the call stack can help you trace the course of execution through a series of nested programs.
The figure shows that emp_query_caller is about to call a subprogram named emp_query. emp_query_caller is currently at the top of the call stack.

After the call to emp_query executes, emp_query is displayed at the top of the Stack tab, and its code is displayed in the Program Body panel.

After completing execution of the subprogram, control returns to the calling program (emp_query_caller), now displayed at the top of the Stack tab.